How To Design A Rail Network
Applying User Centered Design to Albuquerque's Proposed Rail Network
Just two months ago, in October of 2024, The New Mexico Legislature’s Transportation Infrastructure Revenue Subcommittee heard a proposal from Benjamin Lopez, a policy analyst for Amtrak from New Mexico, about an Albuquerque Rapid Rail system. I recommend you read the proposal. For a transit lover like myself, it is extremely exciting to see so much thought go into a system that would be so good for Albuquerque.
The proposal covers a lot of topics. It discusses investment from the state’s sovereign wealth fund, a topic we’ve also touched on here. It discusses the importance of grade separation, proposing an elevated rail system, and makes numerous comparisons to different case studies. I think the case is strong. The aspect I want to touch on today is: where would this train actually go? More specifically, how do you figure that out?
Lopez proposes seven lines, including rough locations of all the stops on each line, and discusses some of the considerations for those selections. He discusses available right of way (ROW), and the city’s goal to have 20% transit ridership on some high volume corridors (currently all stroads). But the underlying principle, he notes, is that the lines should take people to the places they want to go. This statement may appear obvious, but it isn’t always put into practice when making new rail systems. In Denver, a case study Lopez uses, many stations are placed in the middle of massive highways. They were placed there because the ROW was cheap, but no one wants to go to the middle of a highway. Planners might also be tempted to focus on area coverage. But, while a network that covers everywhere in a city equally might look nice on a map, not everywhere in a city is equally useful for people to go to!
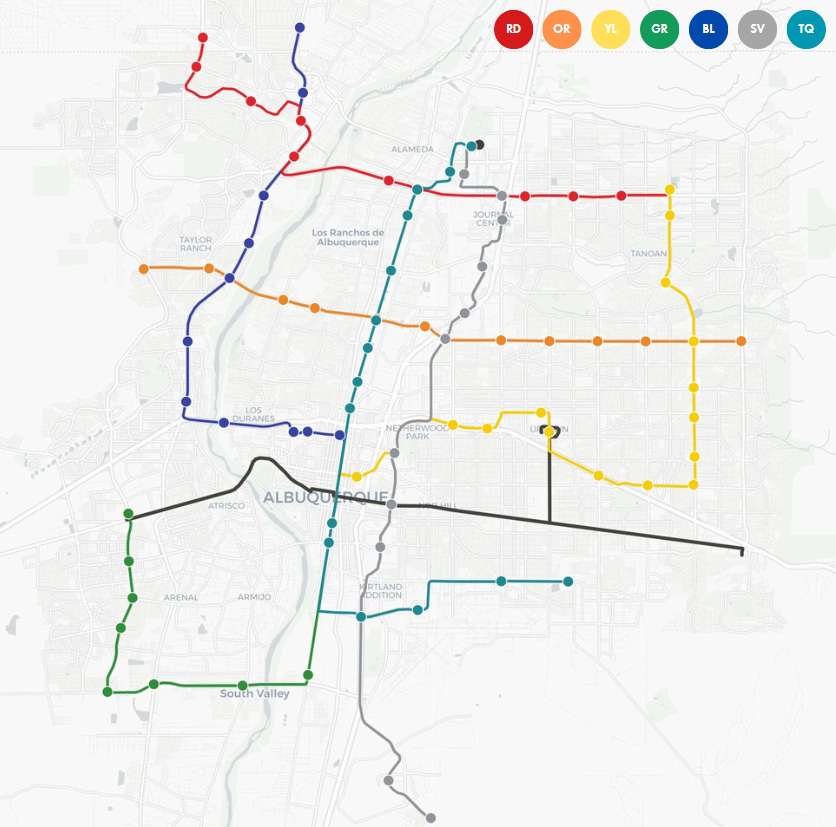
What makes this problem even more important is how difficult it can be to fix mistakes once they are made. Our own piece on the DC Silver Line shows how much can be involved in adding transit to an area missed in the original plan. The same can be true for routes that go where they aren’t useful. Additional development around a train station could *turn* the area into somewhere people want to go, or it could just be a costly, slow, and useless addition to the system. While extremely efficient at moving people, rail is also inflexible. Designers should do all they can to ensure that they are careful about where rail routes go, because they are extremely difficult to change once constructed.
So how *does* one figuring out where it is that people want to go? It isn’t easy, and Lopez indicates that his proposal is based on a robust local knowledge of Albuquerque, but that this isn’t sufficient and his proposed routes shouldn’t be considered final. Planners will need to conduct their own studies to build off of his initial suggestions.
Transit planners often treat route alignment and station selection as a kind of optimization problem. Choose your primary objectives, find the best way to measure them, and then find routes that optimize those parameters. Methods like the FTA STOPS model or the Incremental Transit Model both fall into this category. They rely on taking existing travel and trip data and analyzing it in various sophisticated ways in order to understand how people are likely to behave and to optimize transit routes along desired parameters. This paper by Samanta and Jha is a good example of this phenomenon. They want to balance system cost per person, ridership, and user cost per person. We see in their very first figure a lot of inputs for costs and optimization thereof relative to ridership. But right at the very top is this little black box, “identification of feasible locations for stations.”
The problem with these black boxes is that what goes inside of them can be very important. Clearly, where we build a station has an impact on things like ridership and cost per person. Beyond that, deciding what to optimize for is a political decision. That itself should be based on a data driven understanding of the needs, desires, and behaviors of the people the transit system is going to serve. Even more fundamentally, quantitative data itself has shortfalls. It cannot capture people’s values, frustrations, or joys. Qualitative analysis will have to be a part of the transit planning process.
Fortunately, many writers and scholars on transit planning agree with me. Authors like Jarrett Walker, who wrote “Human Transit”, emphasizes the importance of taking a humanistic approach to transit, one that meets people’s needs rather than strictly optimizing variables. Even the 4th Edition “Transportation Planning Handbook” suggests that planning methods need to be more multidisciplinary. I suggest that Albuquerque, and any other new rail projects, might therefore benefit by integrating elements of user centered design into these existing methods of transit planning.
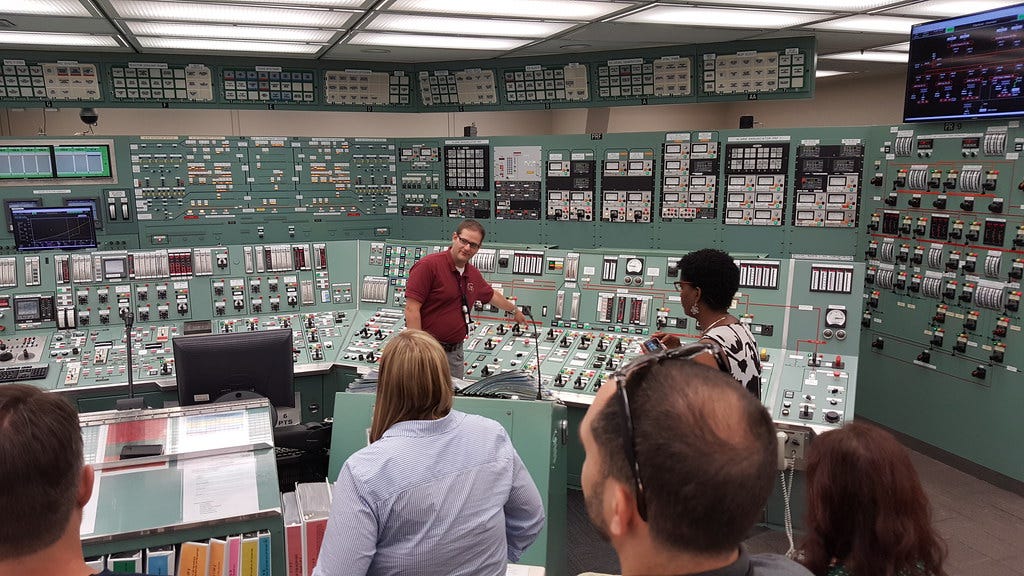
User centered design is where users and their needs drive the design of a system, rather than technical design criteria. We’ve discussed how the design of the control room exasperated and confused operators at three mile island. This is an example of the consequences of letting technical criteria dictate design instead of users. Transit planners could risk doing the same thing in Albuquerque.
In order to avoid this sort of mistake, transit planners will have to engage citizens early in the design process. But how? I want to look at one method for better understanding the needs of both existing and possible future transit users.
You start with interviews. You have to start with interviews because you only think you know what it is that other people want or need. Designers, even those that engage in substantial user testing, often start too late and miss the mark by defining an overly narrow problem which their design solves.
But can you really just ask people what to do and they will tell you the answer? Henry Ford famously said, “If I had asked my customers what they wanted they would have said a faster horse.” But a good designer doesn’t just ask people what to do, she uses interviews to find out what they value. A transit planner wouldn’t simply ask people where to put stations or where the new train lines should go, but would instead use interviews to find out about what they need and want from their trips outside their home.
Thus, we have the first goal of our initial round of interviews. Others might include finding out what frustrates people about traveling to those destinations, why they do or don’t use transit right now, or any untapped wishes or unmet needs related to their current mode of travel. Finding out these things is difficult, and people sometimes aren’t able to just tell you the answers. Thus, the best kind of interview for this initial round is what is called a “semi-structured” interview. This starts with a rough “script” of interview questions, all of which are directed towards explicit research goals. But the interviewer doesn’t just ask questions from the script. Instead the script acts more like a guide, and most of the questions are follow ups which allow the interviewee to elaborate on answers to previous questions.
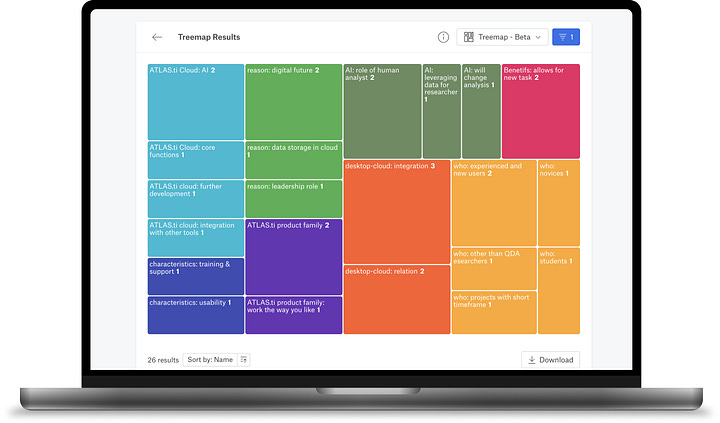
But once we’ve done our interviews, what then? The next step is called, “coding.” Look through the transcripts from your interviews and try to find common patterns. It is basically taking the information you get and grouping or sorting it. This may take multiple passes, kind of like multiple writing drafts. In the end, a transit designer may have a code for “feelings” about how different modes make someone feel, or “pain points” for all the things that generate frustration for people during travel.

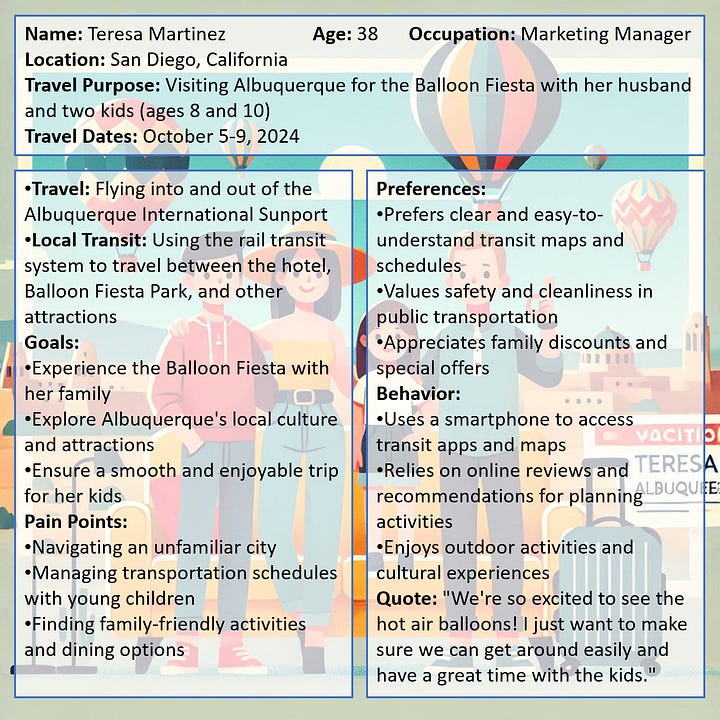
When you are satisfied with the coding of your interview data, it becomes time to apply it. The next step is to create what is called a “persona.” You use your data to create several possible fictional users. This creates a set of archetypes that takes the overwhelming complexity of free form interview answers, and turns that into a more manageable handful of representative individuals. For a transit system, you might have the tourist, who needs to get from the airport to their hotel, and from their hotel to all the major tourist destinations. Or perhaps you have the commuter, who just wants to get to work and home as quickly as possible and hates sitting in traffic. Or perhaps the soccer mom, who sometimes feels more like a chauffeur than a parent between taking their kids between home, school, and all of their extracurricular activities.
These personas don’t just focus on how that person rides transit, but they capture the archetype more holistically. What are their values and goals? How do they behave? What frustrates them? What demographic do they tend to be? What is their income and location? This stage of user research is still very general. We aren’t yet ready to decide on routes and stations yet. But we do now know more about what data we need to gather to make that decision.
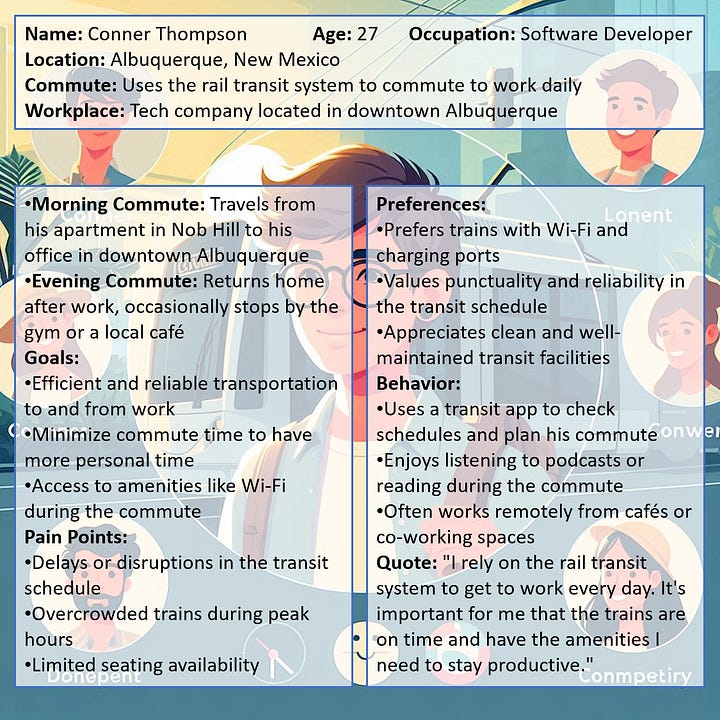
With personas made, designers will have enough information to craft a well formulated survey to gather quantitative data. A survey can answer a question like, what percent of trips go to which destinations? But it is the survey data that puts this quantitative data into context. If survey data suggests that most trips are to local shopping destinations, like the grocery store, and that the location from which the highest frequency of trips starts is the Sunport, does that mean it makes sense to have a line from the Sunport to large shopping centers with grocery stores? This example is obviously silly, but it demonstrates rather well the principle that context matters.
It matters *who* is going to which destinations. It also matters *why* and *when*. To extend the previous example, surveys might indicate that people tend to go to the closest available grocery, so even though such trips are common, people may not be willing to take transit for those trips. But it might also indicate that placing stations near to shopping centers, even if it compromises the total number of people in the catchment area, might entice higher ridership percentages because people are going to that location anyway. A slightly longer walk home from the station might be worth it if the passenger can save another trip by picking up groceries on the way home.
A more concrete example is the shift away from catering to commuters. COVID caused a sizable increase in work from home. Even more people bought cars to avoid crowded transit on their commutes. This is part of why transit agencies, which once focused on moving commuters in and out of the downtown core during rush hours on weekdays, did not fully recover when restrictions ended and COVID fears lessened. But some transit agencies, Albuquerque among them, are now shifting their focus to provide transit for non-work trips. What ABQ Ride found when conducting surveys for their Ride Forward recovery plan, while riders who switched to cars for commuting aren’t likely to switch back, they are still interested in taking the bus on the weekends and evenings to go out for dinner, meet up with friends after work, or take the family on an outing. It sure beats the hassle of traffic and finding parking at these busy destinations!
The surveys I’ve discussed so far have focused on how to get people to start riding transit. But surely transit designers should learn from existing transit users too! While surveys should not focus exclusively on existing transit riders, they should not be left out. At least one persona is likely to be a transit rider. Perhaps Carla the college student who takes the bus to class or Ronaldo the registered nurse who commutes by bus because they're too tired to drive after a 12 hour shift. But different data requires different tools. Buses work very differently from trains, and Albuquerque’s existing bus network might not provide adequate data on rider behaviors for an elevated rail system. While the kinds of trips are likely to be different, a transit planner could learn about how to improve the experience for transit riders.
Surveys alone might not be enough to capture rider experience, and capturing rider experience requires a different data analysis tool than personas. For this task, planners might collect data using direct observation, and analyze it using what is called a “journey map”. A journey map is like a persona in that it aggregates data into an archetype or exemplar. But instead of an archetypical person, it is an archetypical ride. The map shows the high and low points for a transit journey. A regular commuter might enjoy getting settled into their seat and listening to music or a podcast while they ignore the traffic frustrating the drivers out their window. On the other hand, someone running an errand on a less familiar route might be stressed about getting off at the right stop.
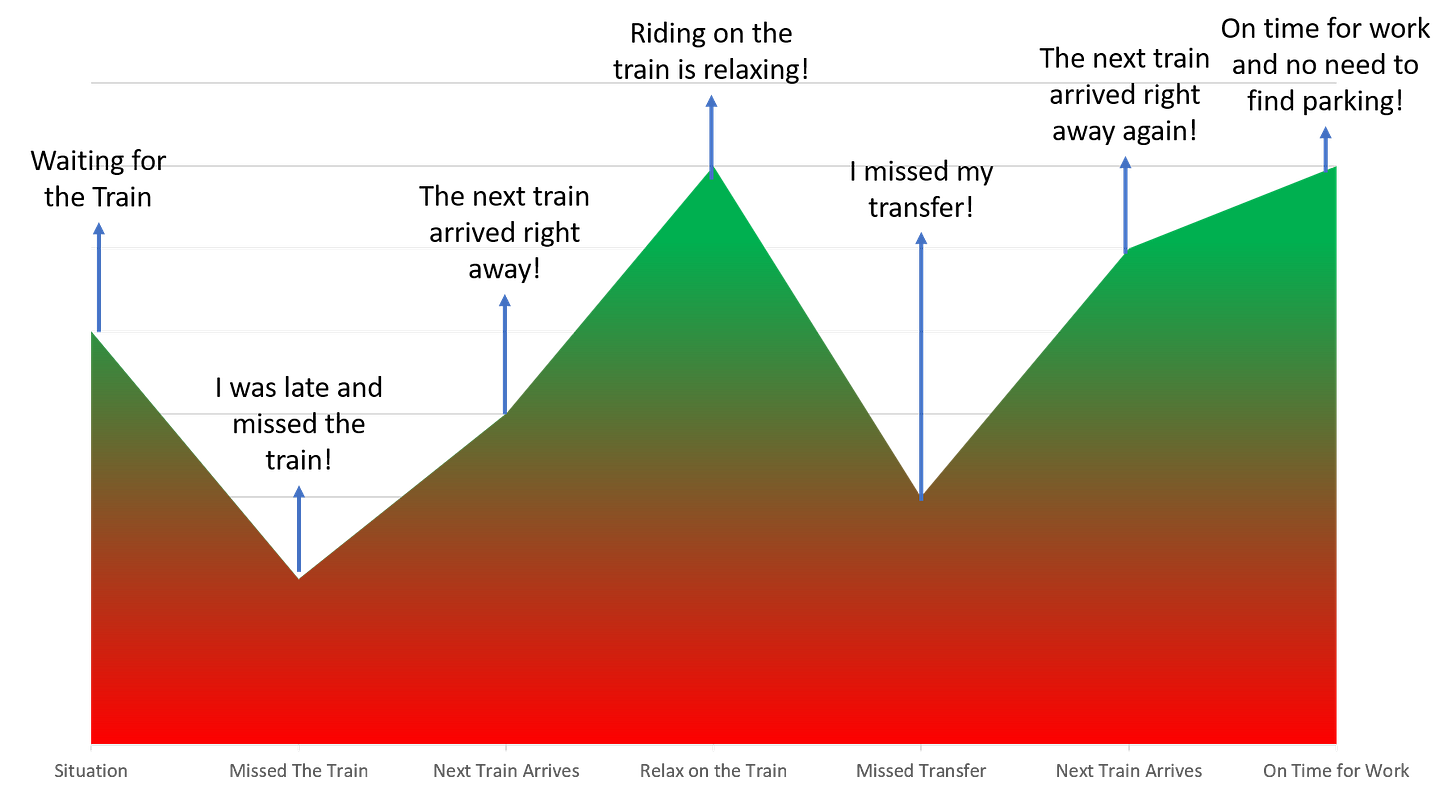
Such stressors, called pain points, are very useful to know. For example, planners might see that riders get most frustrated when a bus is late, or when they have to wait a long time at a transfer because their bus arrives right after their transfer leaves. But planners might notice that, despite survey or interview data indicating that people want to be closer to stops, that in practice riders aren’t bothered by long walks or bike rides. This could help planners decide that having fewer stops, space further apart but with frequent and predictable service is better than having a bus that stops frequently but is thus often late. The goal of journey maps is to identify these pain points and their causes so that they can be mitigated. Building a big, expensive, and difficult to change rail system could be ruined if the rider experience is terrible.
The final ingredient to good user research is iteration. Planners will inevitably have ideas about what the new rail system needs that will clash with what they learn from user data. Therefore, planners will also inevitably get surprising data which they aren’t prepared for. It may thus be necessary to revise survey and interview questions for a second or even third round of data collection. For example, if planners are focused on optimizing the system for commuters but find that even commuters are using it frequently for off-peak trips, they may have to redo data collection to get more information about off-peak trips (like, is off-peak even a useful way to think about those trips anymore?!).
Revision also requires a general willingness to learn from mistakes, and a willingness to prepare for that learning. Experts can be especially prone to perfectionism. We tend to want to get things right the first time, and it can feel like failure when we’re wrong. But being wrong is a necessary, important, and honestly inevitable part of designing complex systems like rapid transit. Accepting, but also preparing, for our errors and miscalculations will inevitably make our designs that much better. Planners will have to be ready to revise and change in the face of unexpected results. This same flexibility will also need to be present if we’re lucky enough here in Albuquerque to actually get this raised rail network built!


